How to Track Bitcoin Adoption by Country Using Node Data

When people talk about Bitcoin adoption, they usually mean price or headlines, but that’s surface-level.
Real adoption is happening deeper in the network itself. It’s about how many people are actually running nodes, where those nodes are located, and how distributed the system really is. This is what gives Bitcoin its strength, not hype, but global infrastructure.
In this guide, you’ll learn how to track Bitcoin adoption by country using Bitnodes, and how to read the data in a way that actually tells you something meaningful about the network.
Step 1: Go to Bitnodes
When you open the site, you’ll land on a live global map showing reachable Bitcoin nodes around the world.
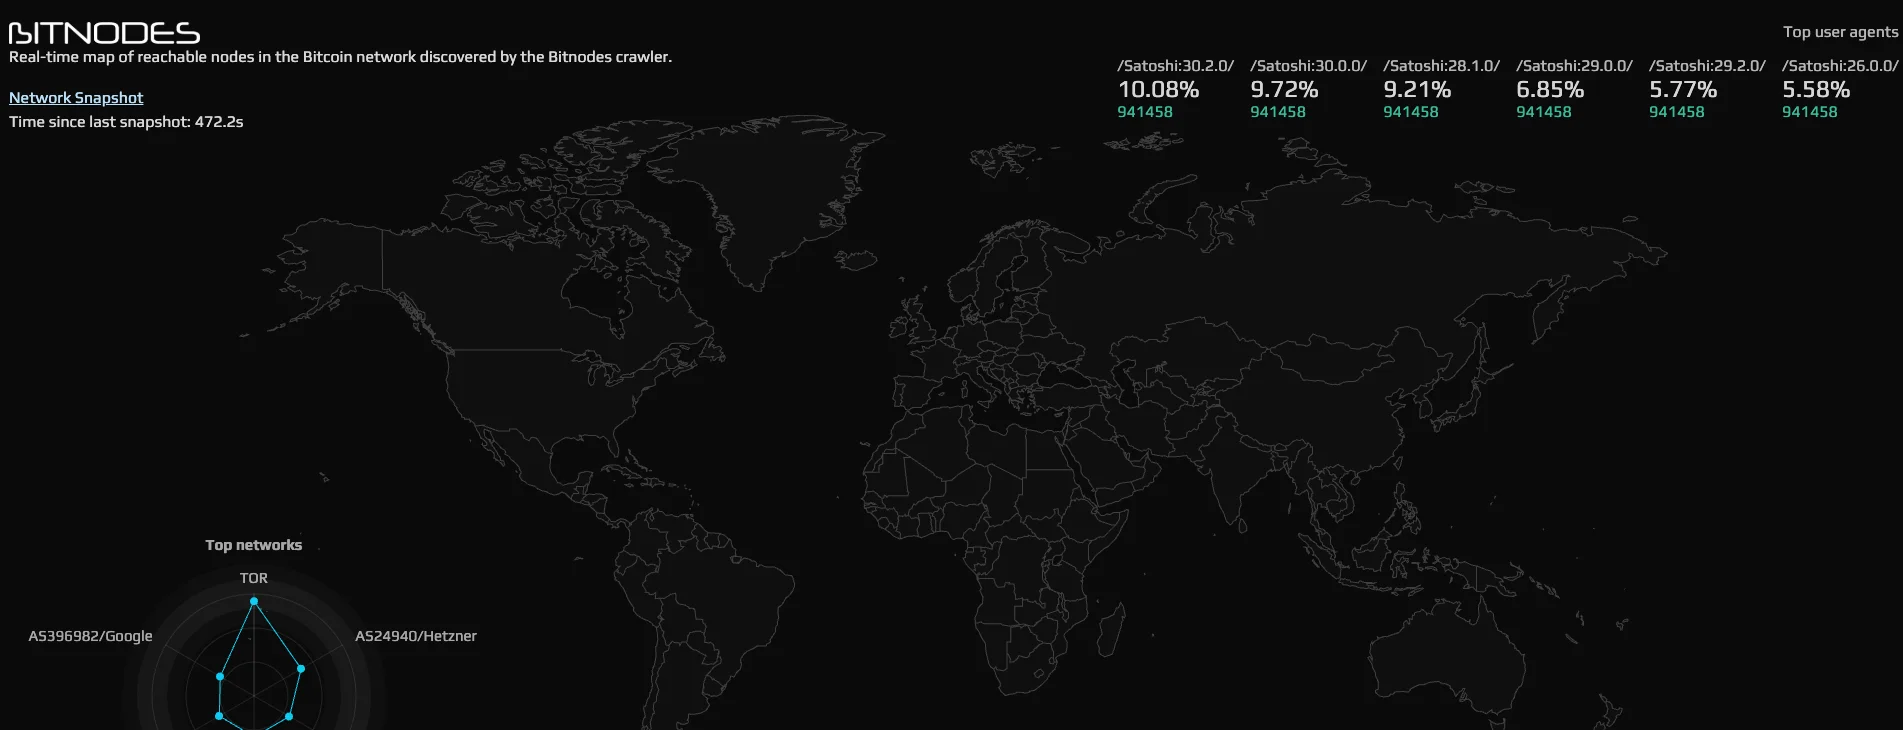
At first glance, it might look technical, but it’s actually simple once you break it down.
The map represents where Bitcoin nodes are physically located. Each point is a node contributing to the network. The more spread out these nodes are, the more decentralized Bitcoin becomes.
You’ll also notice key data around the screen:
Reachable nodes count (total active nodes globally)
Consensus height (current block height of the network)
Top user agents (different Bitcoin software versions being used)
Top networks (hosting providers or infrastructure like TOR, AWS, etc.)
This gives you a real-time snapshot of Bitcoin’s infrastructure, not price, not speculation, but the actual backbone of the network.
Step 2: Open “Network Snapshot” and Select Countries
Now click on “Network Snapshot” in the top left.
This takes you to a more detailed breakdown of the network. Here, you’ll see a structured overview including total nodes, node types, and distribution.
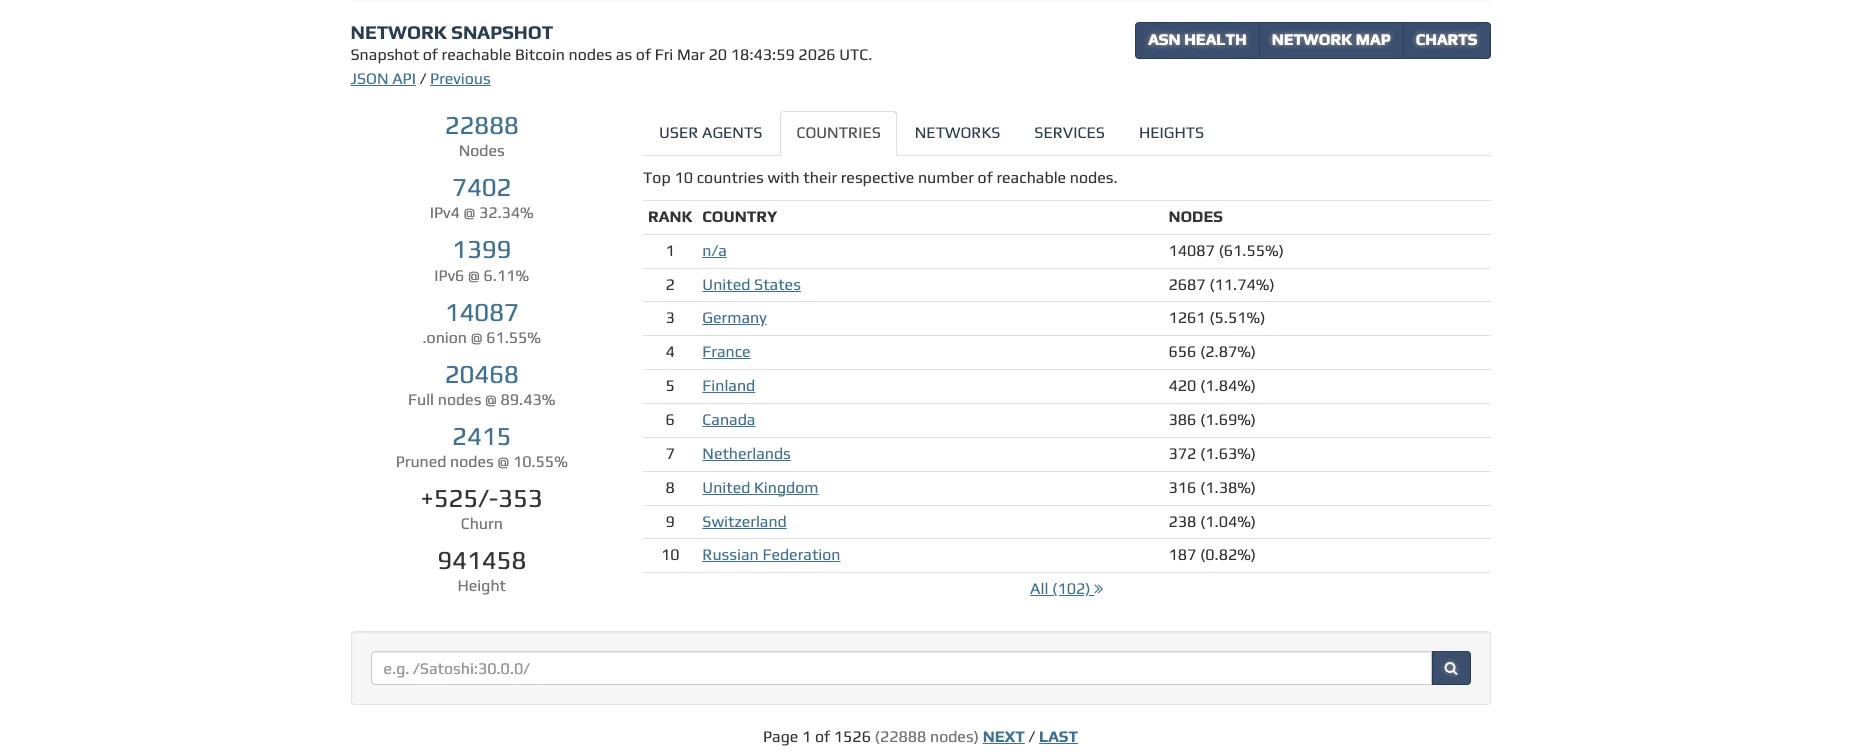
The key part is switching to the “Countries” tab.
This shows you exactly where Bitcoin nodes are concentrated globally.
You’ll see rankings like:
Which countries have the most nodes
The percentage share of each country
How dominant certain regions are
For example, you might notice that countries like the United States and Germany consistently rank high. This tells you where infrastructure is strongest, but also where centralization risks might exist.
You’ll also see additional metrics like:
Full nodes vs pruned nodes (how complete the data storage is)
IPv4, IPv6, and TOR usage (how nodes connect to the network)
Network churn (nodes joining and leaving)
This is where the map turns into insight.
In addition, if you would like to learn How to Track Bitcoin Whale Activity Using Live Data, check it out on the Bitcoin Everlight education section.
Why This Matters
Bitcoin’s value doesn’t just come from scarcity, it comes from decentralization.
If nodes were all concentrated in one country, Bitcoin would be vulnerable. Governments could regulate it, shut it down, or control access. But when nodes are distributed globally, no single entity has power over the network.
Tracking nodes by country helps you understand:
Where Bitcoin is actually being adopted
How resilient the network is
Whether decentralization is improving or weakening
It also reveals something most people ignore: adoption isn’t just about users, it’s about participants. Running a node is one of the strongest signals of belief in Bitcoin.
Conclusion
By using Bitnodes, you’re not just looking at data, you’re looking at the foundation of Bitcoin itself.
Over time, you’ll start to notice shifts in where nodes are growing, how the network evolves, and which regions are becoming more important. This gives you a deeper perspective than price ever could.
Because in the end, Bitcoin’s strength isn’t just in how many people buy it, but in how many people help run it.