How to Check Bitcoin Dominance (BTC.D) Using TradingView

Why Bitcoin Dominance Matters
Bitcoin dominance measures Bitcoin’s share of the total cryptocurrency market capitalization. It answers a critical question: where is capital concentrating right now, Bitcoin or altcoins?
When dominance rises, capital is flowing into Bitcoin faster than the rest of the market. When it falls, capital is rotating into altcoins. This makes BTC.D one of the clearest indicators for understanding market cycles, risk appetite, and trend shifts in crypto.
Step 1: Open TradingView
Go to tradingview.com and open the platform, you do not need a paid account to view Bitcoin dominance.
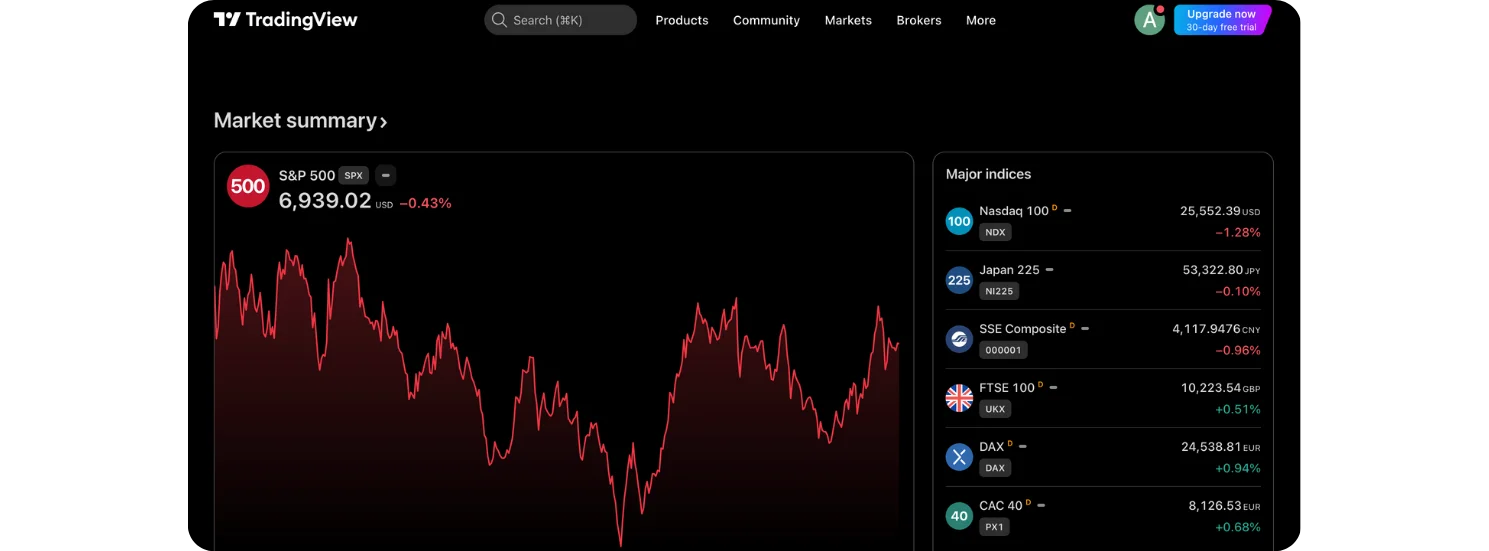
The homepage shows general market data, but the dominance chart is accessed through TradingView’s symbol search.
Step 2: Search for BTC.D
Use the search bar at the top of the screen and type:
BTC.D
Select Market Cap BTC Dominance (%) under the crypto indices section (usually labeled as coming from CRYPTOCAP).
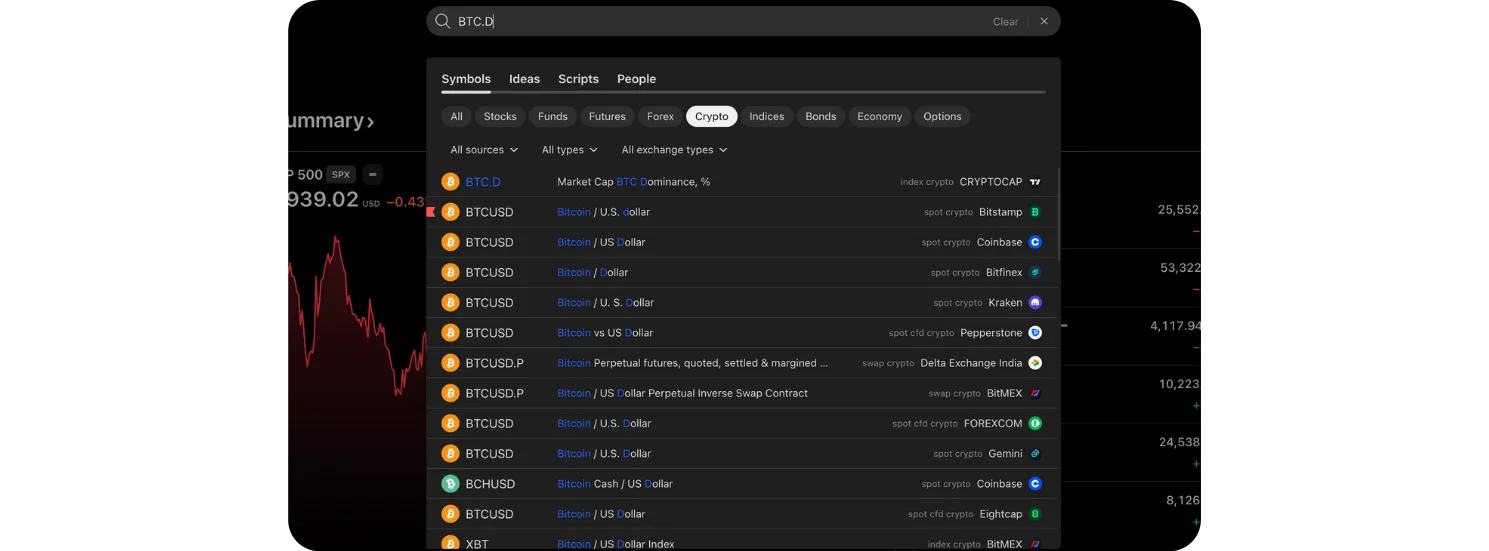
This opens the Bitcoin dominance chart.
Step 3: Read the Bitcoin Dominance Chart
Once BTC.D is loaded, the chart shows Bitcoin’s market share as a percentage, not a price.
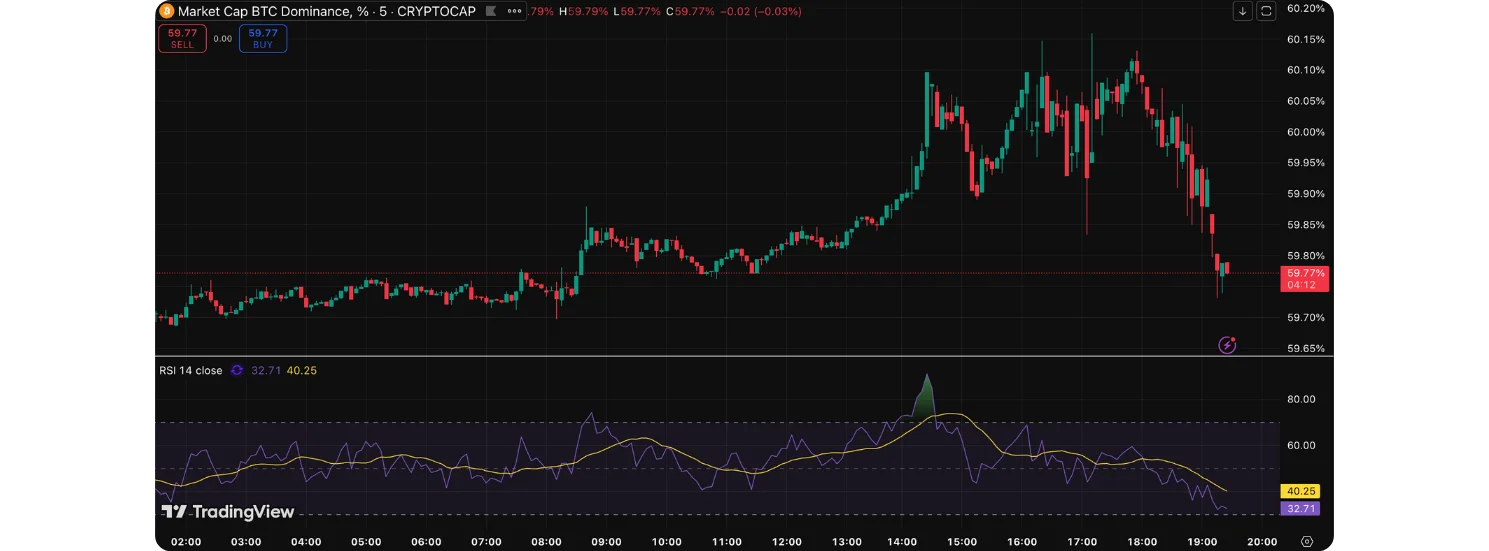
Key elements visible on the screen:
Candlestick chart: Each candle represents changes in dominance over time
Percentage scale (right side): Shows how much of the total crypto market Bitcoin currently controls.
Trend structure:
Higher highs and higher lows indicate rising dominance.
Lower highs and lower lows indicate falling dominance.
A dominance value around 59–60% means Bitcoin holds roughly 60% of the entire crypto market’s value.
Also, if you would like to learn How Bitcoin Fees, Blocks, and Hashrate Connect (Explained Visually), check it out on the Bitcoin Everlight education section.
Step 4: Adjust the Time Frame
Use the time-frame selector to change how much data you’re viewing:
Lower time frames (5m, 15m, 1h)
Useful for short-term sentiment shifts and intraday rotations.Higher time frames (1D, 1W, 1M)
Best for identifying macro trends and full market cycles.
Long-term charts help reveal whether the market is in:
A Bitcoin-led phase
An altcoin expansion phase
A transition period between the two
How to Interpret BTC.D in Practice
Rising Bitcoin dominance
Capital prefers Bitcoin
Risk-off behavior
Altcoins often underperform
Falling Bitcoin dominance
Capital rotating into altcoins
Higher risk appetite
Altcoin strength increases
Sideways dominance
Market uncertainty
Mixed performance across assets
BTC.D does not predict price direction on its own, but it explains where money is flowing, which is often more important.
Final Takeaway
Bitcoin dominance is a structural indicator, not a trading signal. It helps you understand who is winning the capital battle inside the crypto market.
By regularly checking BTC.D on TradingView and adjusting the time frame, you gain a clearer picture of market cycles, risk shifts, and whether Bitcoin or altcoins currently have the advantage.
Used correctly, BTC.D adds context that price charts alone cannot provide.