How to Analyze Bitcoin Miner Revenue to Identify Market Stress and Potential Sell-Offs

Understanding Bitcoin miner revenue is essential for analyzing the health and stability of the network. Miners play a critical role in securing the blockchain, and their profitability often influences market behavior. When revenues decline, miners may be forced to sell their holdings to cover operational costs, potentially creating downward pressure on Bitcoin’s price.
This guide will walk you through how to track miner revenue using Blockchain.com, interpret the data, and identify signs of miner stress that could signal important market movements.
Step 1: Visit the Blockchain Miner Revenue Chart
Begin by navigating to the official Blockchain.com chart using the link below:
https://www.blockchain.com/explorer/charts/miners-revenue
This page provides real-time and historical data on the total income earned by Bitcoin miners. The figures include both block rewards and transaction fees, offering a comprehensive view of mining profitability.
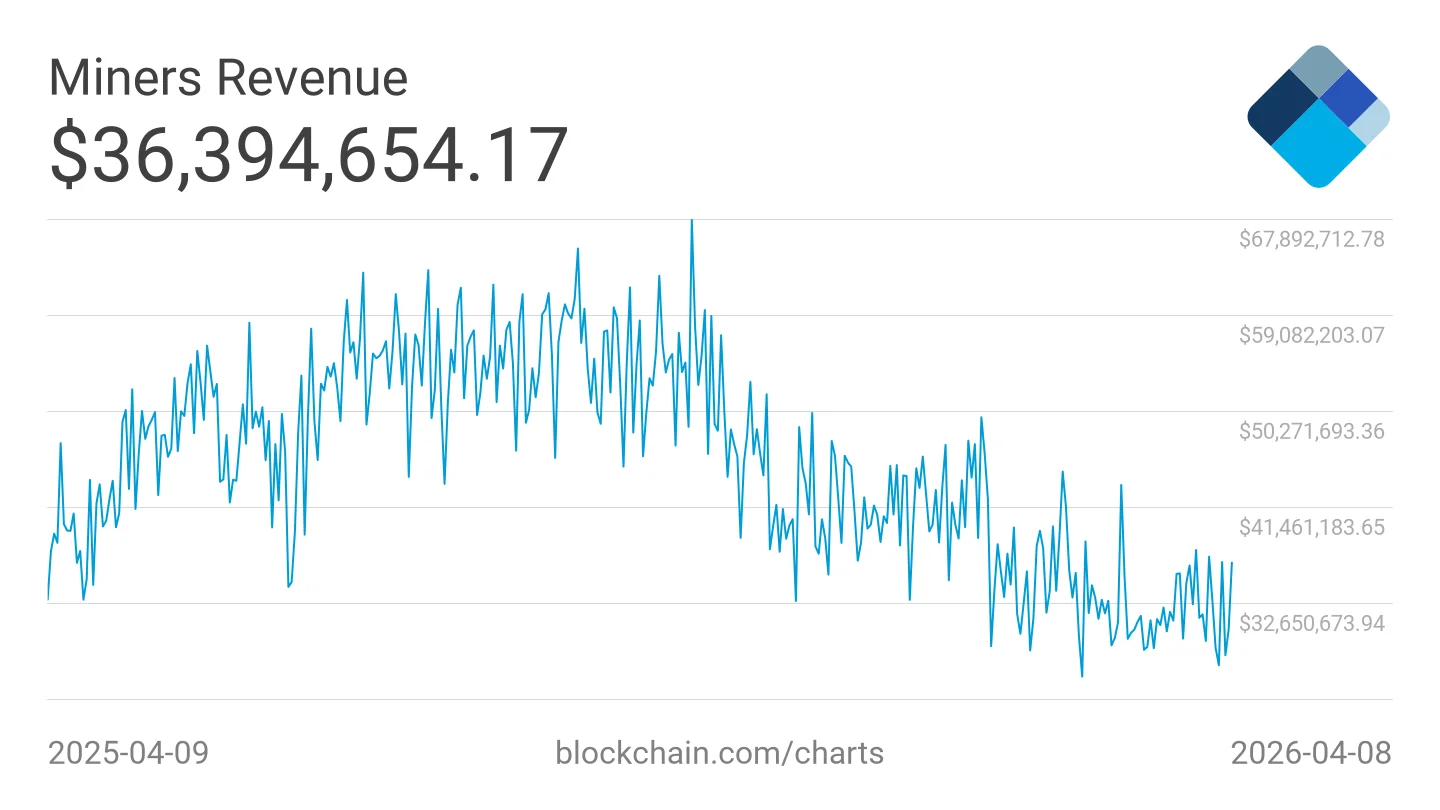
Once you access the site, you will be presented with a visual chart displaying miner revenue trends over time.
Step 2: Analyze the Miner Revenue Chart
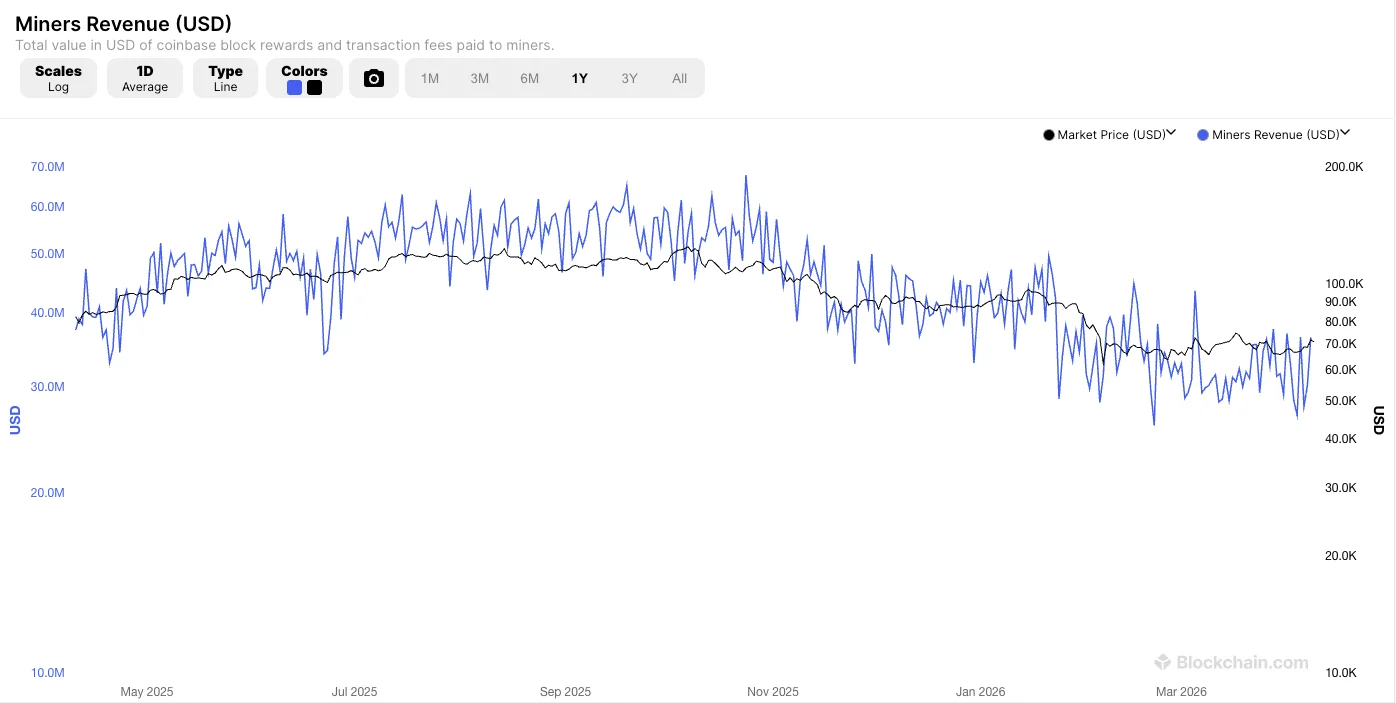
After opening the chart, you will see the Miners Revenue (USD) graph. This metric represents the total daily earnings of Bitcoin miners, combining newly minted BTC and transaction fees paid by network users.
Key Elements of the Chart
Revenue Line: Displays daily miner income in U.S. dollars.
Market Price Overlay: Shows Bitcoin’s price alongside miner earnings for comparative analysis.
Time Filters: Allows you to adjust the timeframe to 1 month, 3 months, 6 months, 1 year, or all-time data.
Scales and Chart Types: Provides options to customize how the data is displayed.
Data Source: Ensures reliability by aggregating blockchain activity.
How to Interpret the Data
Rising Revenue: Indicates strong network activity and improved miner profitability.
Declining Revenue: Suggests reduced profitability, often caused by falling prices or lower transaction fees.
Sharp Drops: May signal financial stress among miners, increasing the likelihood of Bitcoin sell-offs.
Correlation with Price: When revenue rises alongside Bitcoin’s price, it typically reflects bullish market conditions.
By studying these patterns, investors can gain insights into the broader health of the Bitcoin ecosystem.
In addition, if you would like to learn more about How to Use the Puell Multiple to Identify Bitcoin Market Cycles (Undervalued vs Overheated Zones), check it out in the Bitcoin Everlight education section.
Step 3: Switch the Scale to Logarithmic
To gain deeper insights, adjust the chart’s scale by selecting “Scales” in the top-left corner and choosing “Log” instead of “Linear.”
What Is a Logarithmic Scale?
A logarithmic (log) scale represents percentage-based changes rather than absolute price movements. This approach is particularly useful for assets like Bitcoin, which have experienced exponential growth over time.
Benefits of Using the Log Scale
Improved Trend Visibility: Highlights long-term patterns more clearly.
Better Historical Comparisons: Makes early data more meaningful when compared to recent values.
Reduced Distortion: Prevents large price increases from overshadowing earlier trends.
Enhanced Market Analysis: Helps identify cycles, growth phases, and corrections more accurately.
Using the log scale allows analysts to interpret miner revenue trends with greater precision.
Why Tracking Bitcoin Miner Revenue Is Important
Monitoring miner revenue provides critical insights into market dynamics and network sustainability.
Key Reasons to Watch This Metric
Assess Network Health: Healthy miner revenues indicate a secure and stable Bitcoin network.
Identify Miner Stress: Declining profitability can pressure miners to sell their BTC holdings.
Predict Potential Sell-Offs: Increased selling by miners may contribute to market downturns.
Evaluate Market Cycles: Miner behavior often aligns with bullish and bearish trends.
Understand Post-Halving Effects: Revenue typically declines after Bitcoin halvings, influencing supply dynamics.
Enhance Investment Decisions: On-chain data helps investors make informed, data-driven choices.
By incorporating miner revenue analysis into your research, you gain a powerful tool for anticipating market movements.
Conclusion
Analyzing Bitcoin miner revenue is a fundamental component of on-chain analysis. By using Blockchain.com’s Miner Revenue chart, you can monitor miner profitability, detect stress levels, and identify potential sell-off risks.
Switching to a logarithmic scale further enhances your ability to interpret long-term trends and understand Bitcoin’s growth trajectory. Whether you are a trader, investor, or researcher, tracking miner revenue provides valuable insights into the forces shaping the cryptocurrency market.
Understanding miner behavior ultimately leads to smarter, more strategic decisions in the evolving world of Bitcoin.