How To View Bitcoin on a Logarithmic (Log) Chart

Bitcoin’s price history spans multiple orders of magnitude, from fractions of a dollar to tens of thousands. Viewing that entire history on a standard linear chart often leads to distorted conclusions, where early price action appears insignificant and recent moves look exaggerated.
A logarithmic (log) chart solves this problem by displaying price changes proportionally rather than absolutely. This guide shows how to enable log scale for Bitcoin on TradingView and explains why it is essential for long-term analysis.
Step 1: Open TradingView
Go to TradingView and land on the main page. From here, access the charting interface where price data is displayed.
No account is required to view charts or change scale settings.

Step 2: Search for Bitcoin and Use a Long Timeframe
Use the search bar to find Bitcoin (BTC) against a fiat pair such as BTC/USD.
Once the Bitcoin chart loads, set the timeframe to Weekly (1W) or Monthly (1M).
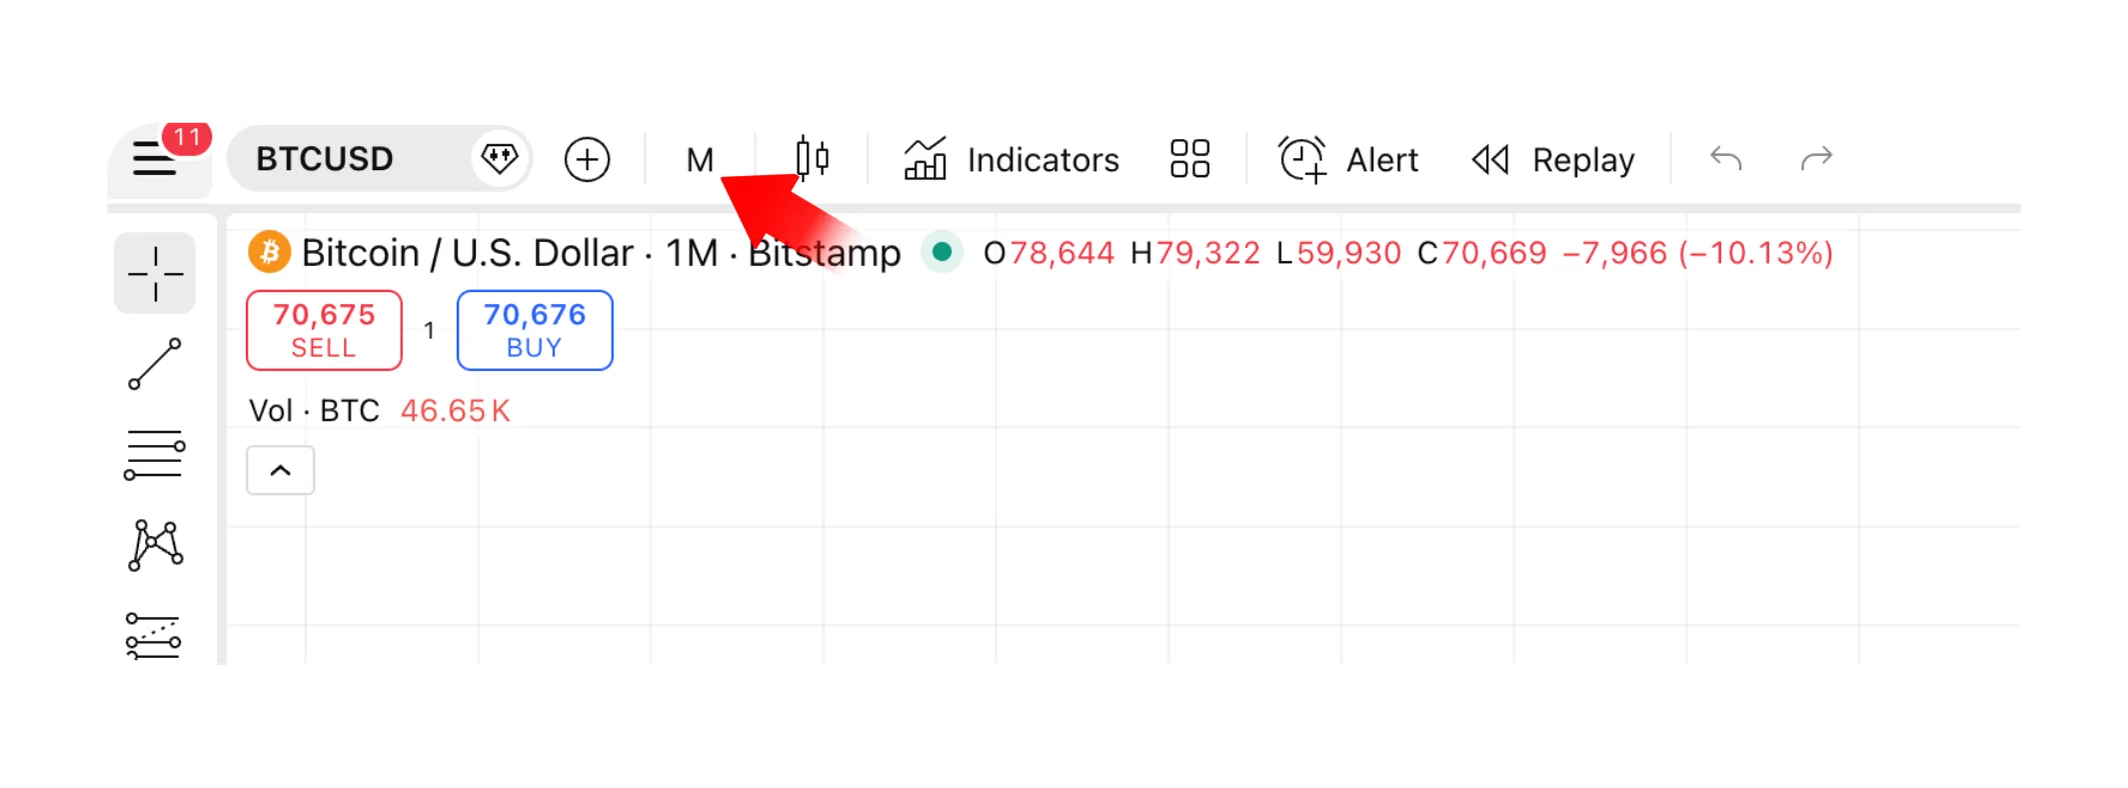
Logarithmic charts are designed for long-term analysis. Short timeframes compress too much data and reduce the usefulness of the scale.
Step 3: Enable Logarithmic Scale
Right-click directly on the price axis on the right side of the chart.
In the menu that appears, enable Logarithmic by checking the box.
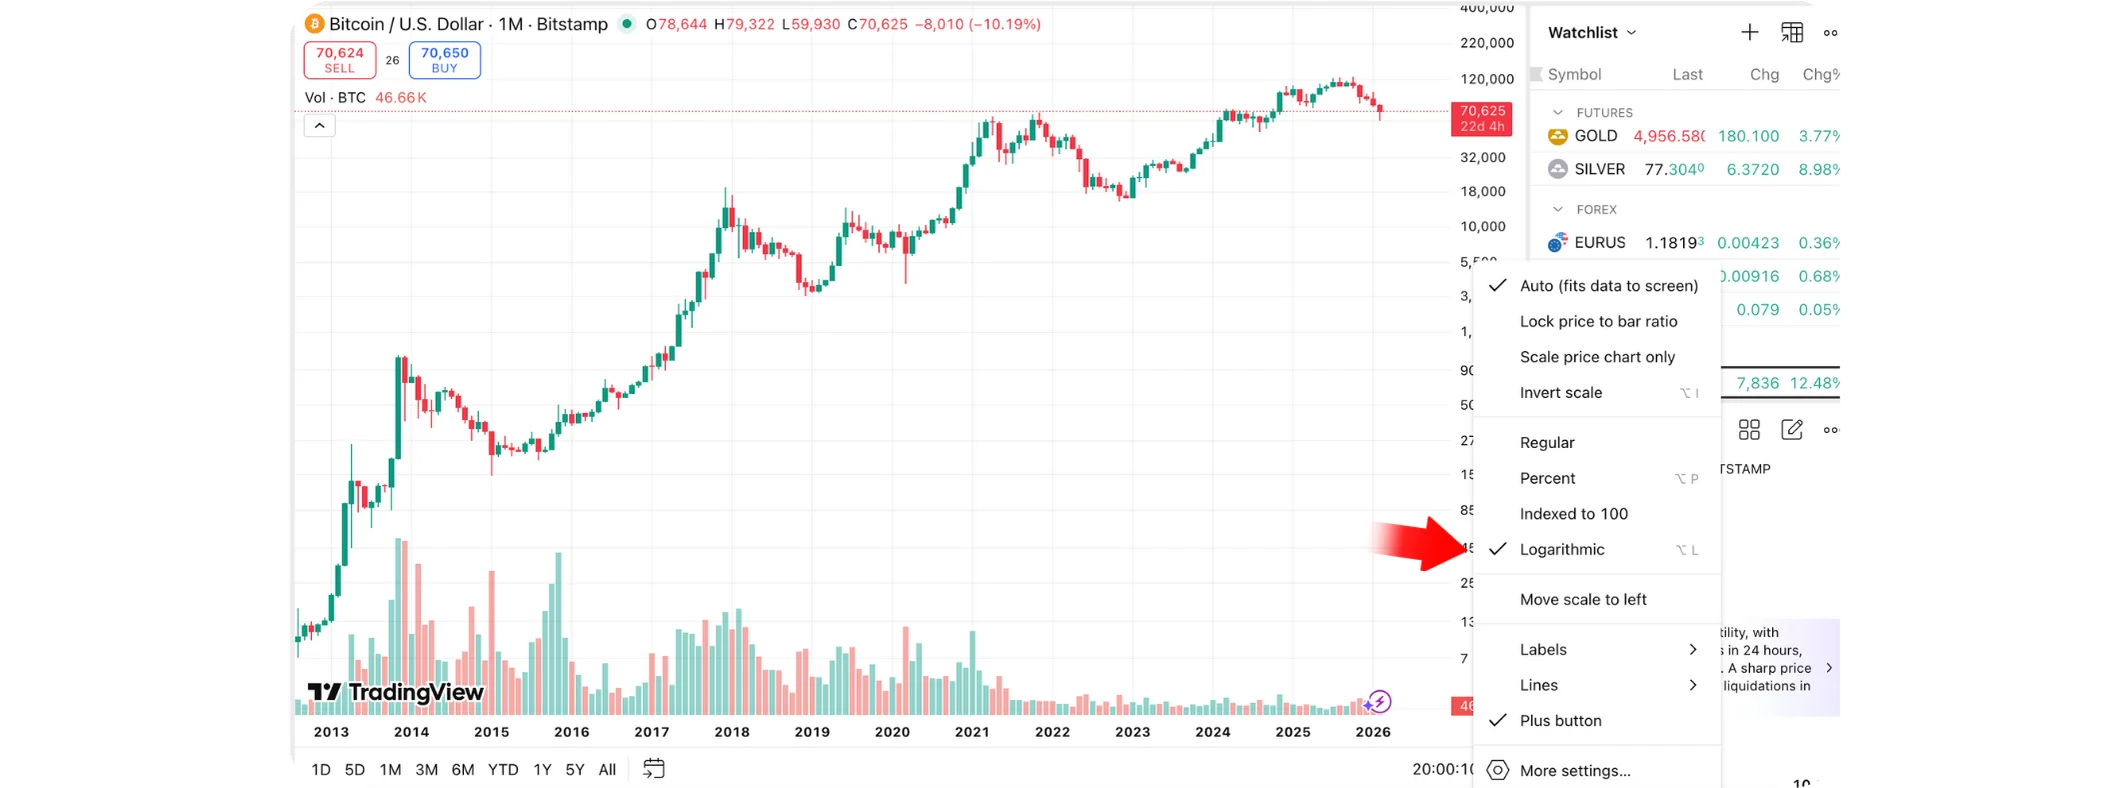
The chart will instantly redraw using a log scale.
In addition, if you would like to learn How to Buy Bitcoin Everlight (BTCL), check it out on the Bitcoin Everlight education section.
Why Log Scale Is Useful for Bitcoin
A linear chart measures price in absolute terms. A move from $100 to $200 occupies the same vertical space as a move from $20,000 to $20,100, even though the percentage change is completely different.
A logarithmic chart fixes this by representing percentage-based growth instead of raw price distance. On a log chart:
A 100% move looks the same at any price level
Early Bitcoin cycles are no longer visually flattened
Long-term trends become readable and comparable
Market structure across multiple cycles is easier to identify
This makes log charts especially useful for assets like Bitcoin that grow exponentially rather than linearly.
Using a linear scale for long-term Bitcoin analysis often leads to emotional interpretations, where recent volatility feels unprecedented and early history feels irrelevant. Log scale restores proportional context.
Conclusion
Bitcoin’s price history cannot be accurately understood on a linear chart alone. Logarithmic charts provide a clearer view of long-term trends, growth phases, and market cycles by focusing on proportional change rather than absolute price moves.
By switching to a log scale on higher timeframes, Bitcoin’s price behavior becomes easier to interpret and far less misleading. For anyone analyzing Bitcoin beyond short-term fluctuations, log scale is not optional, it is essential.