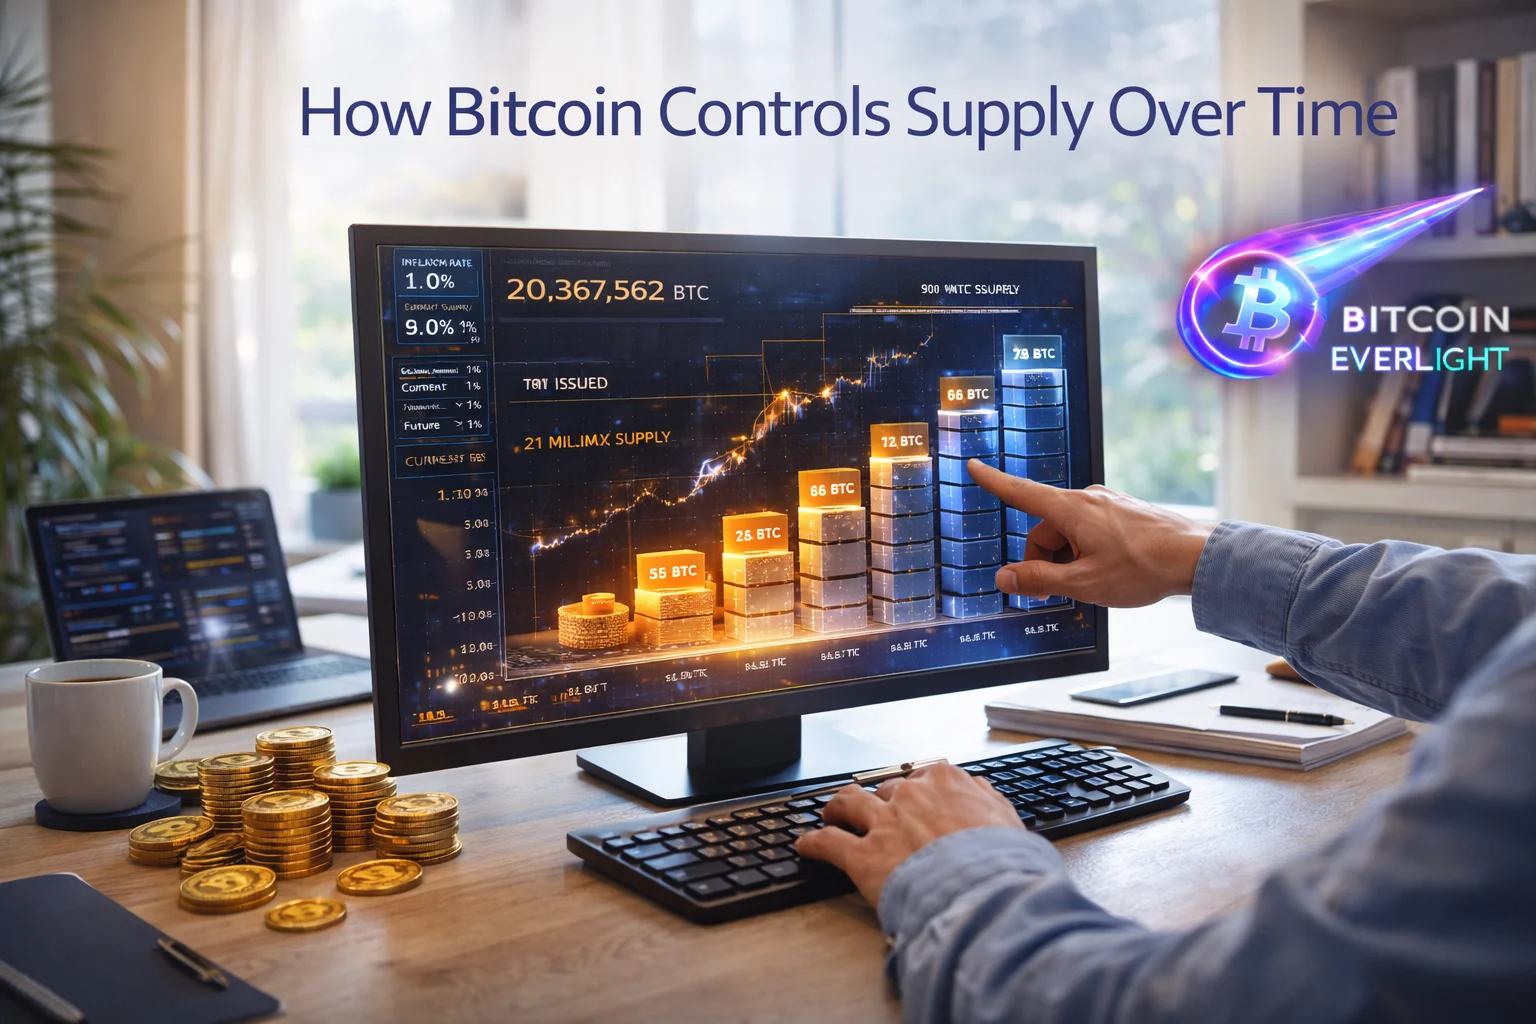
How Bitcoin Controls Supply Over Time
Most Bitcoin guides stop at one simple idea: the halving.
But Bitcoin’s monetary policy is much more precise, and much more transparent, than a single event every four years.
Bitcoin’s supply is governed by math, not decisions. Every block, every day, and every decade follows a predefined issuance schedule that anyone can verify. In this guide, we’ll use visual tools from BitcoinVisuals.com to understand how Bitcoin’s supply is issued over time and how daily block rewards steadily decline long before each halving arrives.
Instead of focusing on price or speculation, this guide focuses on how new bitcoin actually enters circulation.
Step 1: Open BitcoinVisuals and View the Future Bitcoin Supply
Start by visiting bitcoinvisuals.com.
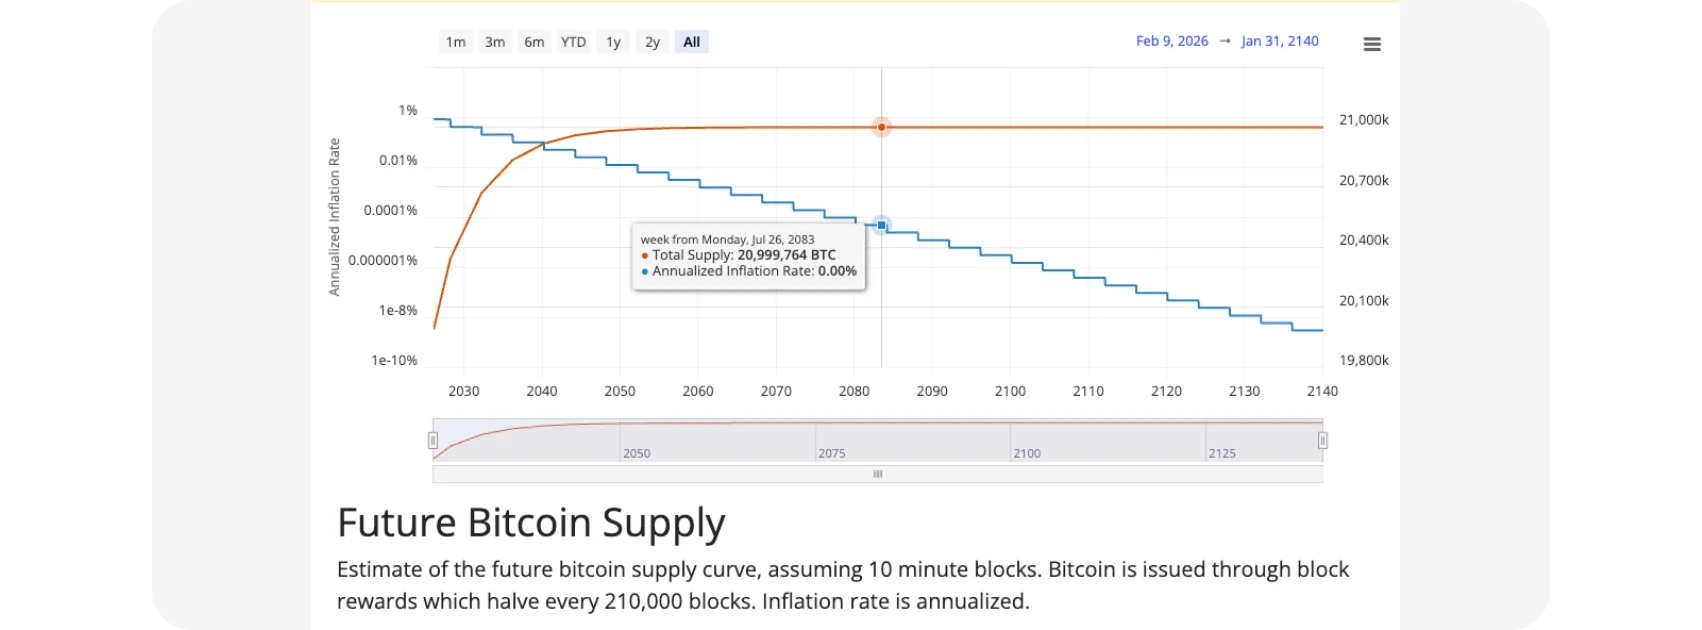
On the homepage, locate the section titled “Future Supply.”
This chart visualizes Bitcoin’s total supply curve all the way to the year 2140, assuming consistent 10-minute block intervals.
What this chart shows:
The orange line represents total bitcoin supply approaching the 21 million cap.
The blue line represents Bitcoin’s annualized inflation rate, steadily declining over time.
The inflation scale is logarithmic, highlighting how issuance becomes negligible in later decades.
This visualization makes one thing clear:
Bitcoin’s inflation doesn’t just drop every four years, it continuously trends toward zero.
Step 2: Understand How Inflation Decays Over Time
Looking closer at the Future Bitcoin Supply chart, you’ll notice that Bitcoin’s inflation rate collapses rapidly in the early years and then declines more gradually after each halving.
This matters because:
Bitcoin’s inflation rate is predictable decades in advance.
Unlike fiat currencies, Bitcoin does not react to economic conditions, debt, or policy changes.
Every future unit of issuance is already known.
By the time Bitcoin approaches its final supply phase, the inflation rate becomes effectively zero, long before the last bitcoin is mined.
This visual helps explain why Bitcoin is often described as having a hard monetary ceiling, not just limited supply.
In addition, if you would like to learn How To View Bitcoin on a Logarithmic (Log) Chart, check it out on the Bitcoin Everlight education section.
Step 3: Analyze Bitcoin’s Block Reward Issued Per Day
Next, scroll to the section titled “Block Reward Per Day.”
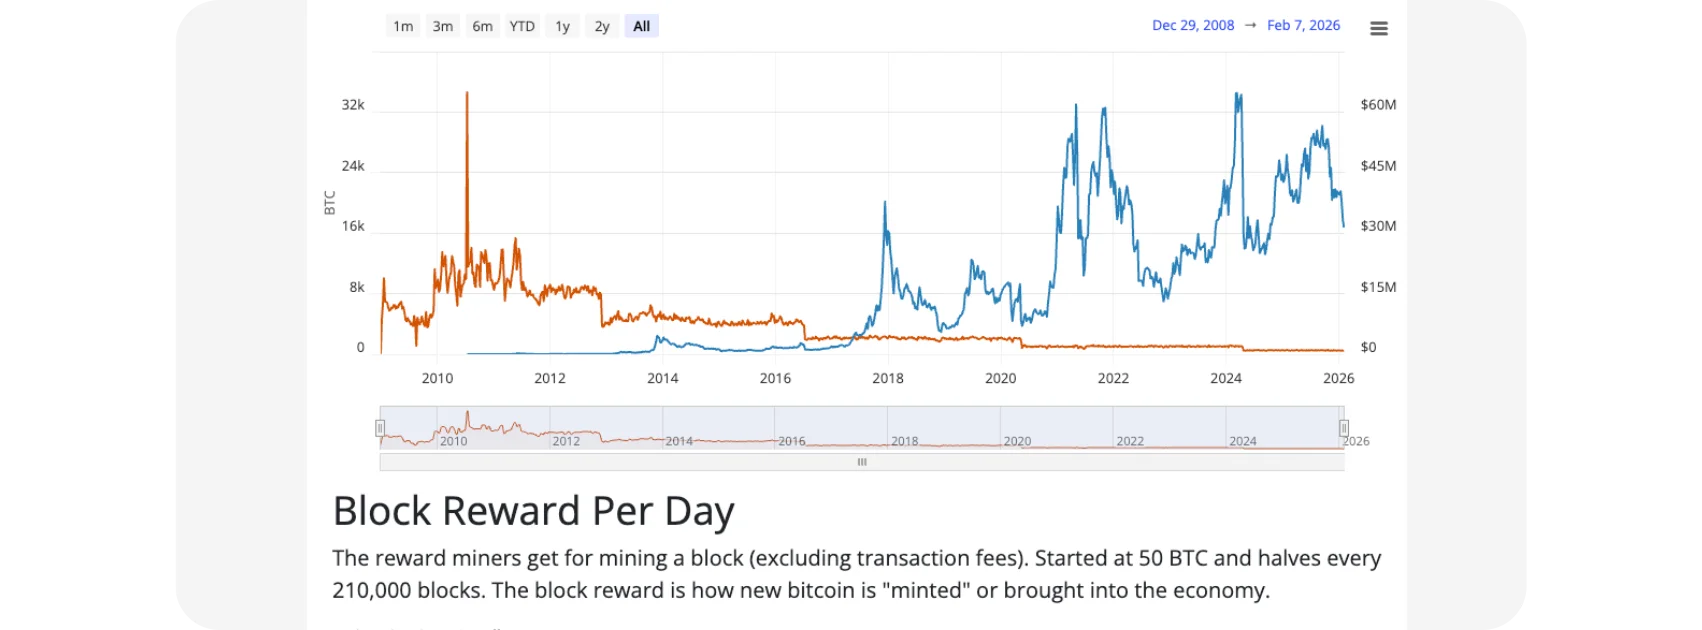
This chart shows how many new bitcoins are issued daily through mining rewards, excluding transaction fees.
What you’ll see:
The orange line shows bitcoin issued per day.
The issuance drops sharply at each halving.
Over time, daily issuance trends toward zero.
This visualization is important because it shows that Bitcoin’s supply shock isn’t sudden, it’s progressive. Each halving reduces issuance, but the real effect is the long-term decline in how much new supply enters the market every single day.
This is how Bitcoin transitions from a distribution phase into a scarcity phase.
Why This Is Important to Understand
Most discussions about Bitcoin scarcity focus on price or hype. These charts show the mechanism behind scarcity.
Understanding Bitcoin’s issuance schedule helps you:
See why Bitcoin behaves differently from inflationary currencies.
Understand miner incentives and long-term network sustainability.
Recognize that Bitcoin’s monetary policy is transparent, fixed, and immune to human intervention.
Instead of guessing what Bitcoin might do, you can verify how it works.
Final Conclusion
By visualizing future supply and daily block rewards, you can clearly see how Bitcoin transitions from issuance to scarcity over time. These charts move the conversation beyond halving headlines and show the full structure of Bitcoin’s supply mechanics.
If you want to understand Bitcoin at a deeper level, studying how new bitcoin enters circulation, and how that process fades, is essential.
Bitcoin doesn’t promise scarcity, It mathematically enforces it.